Key figures and indicators
Key elements to discover Edenred.
Edenred is the global leader in Benefits & Engagement and Mobility.
With more than 1 million client companies across 44 countries, Edenred's platform gives more than 60 million users access to the services and products of more than 2 million partner merchants.
Edenred offers digital solutions dedicated to employees (meal vouchers, commuting, gift cards, wellness, rewards, and preferential offers), fleet managers (multi-energy solutions including EV charging, maintenance services, VAT refund services, tolls, and parking), and corporate payments (virtual cards).
Guided by Edenred's purpose, “Enrich connections. For good.”, these solutions enhance employees' well-being and purchasing power and simplify the lives of professional drivers. They promote access to healthier food, more environmentally friendly products, and more sustainable mobility. Finally, they improve the attractiveness and efficiency of businesses while vitalizing the employment market and local economies.
Edenred's 12,000 employees are committed to making the world of work a connected ecosystem that is safer, more efficient and more responsible every day.
In 2025, thanks to its unique technology platform, Edenred generated a business volume of €49 billion, mainly through mobile applications, online platforms, and cards.
Edenred is listed on the Euronext Paris stock exchange and included in the following indices: CAC Next 20, CAC Large 60, Euronext 100, Euronext Tech Leaders, FTSE4Good, DJBIC Europe Index and DJBIC World Index.
2025 annual results : Edenred achieves all its operating and financial targets, and marks a record year
In € million
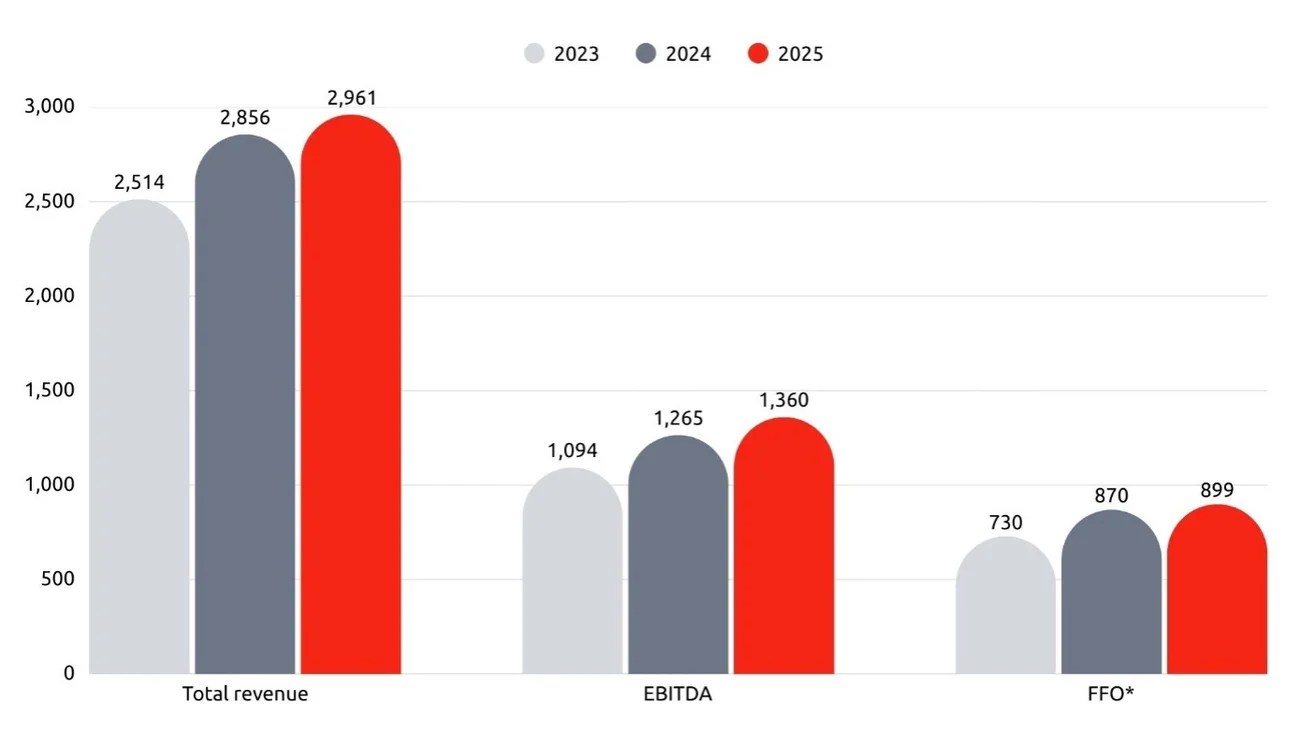
* Funds From Operations.
A unique business model
- Total revenue, which amounted to €2.96 billion in 2025, consisted of operating revenue and other revenue.
- The most relevant indicator for measuring the Group’s performance is operating revenue of €2,732 million in 2025. Operating revenue corresponds to:
- operating revenue generated by prepaid vouchers managed by Edenred,
- operating revenue from value-added services such as incentive programs, human services and event-related services.
- Other revenue amounted to €229 million in 2025. Other revenue is interest generated by investing cash over the period between the issue date and the reimbursement date for prepaid vouchers, and the loading date and the redeeming date for prepaid cards.
- The most relevant indicator for measuring the Group’s performance is operating revenue of €2,732 million in 2025. Operating revenue corresponds to:
- EBITDA, which corresponds to total income minus operating expenses (excluding depreciation, amortization and provisions), stood at €1,360 million for 2025.
- EBIT which corresponds to operating profit before other income and expenses, reflects the economic performance of the business. It stood at €1,094 million for 2025.
Buoyant growth momentum in the two main business lines
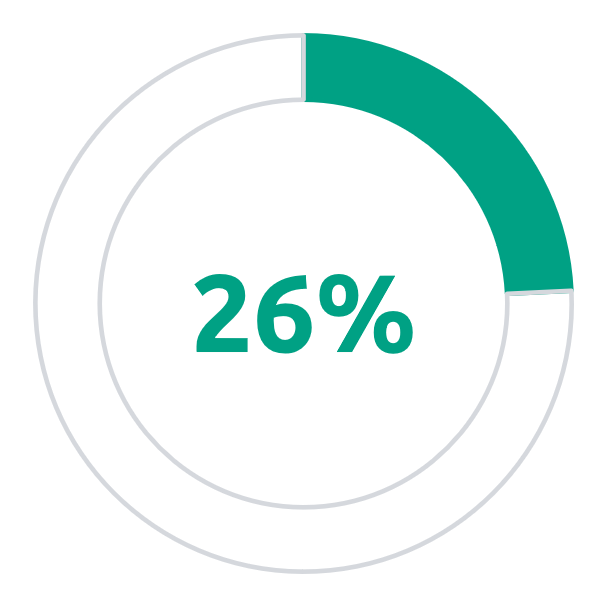
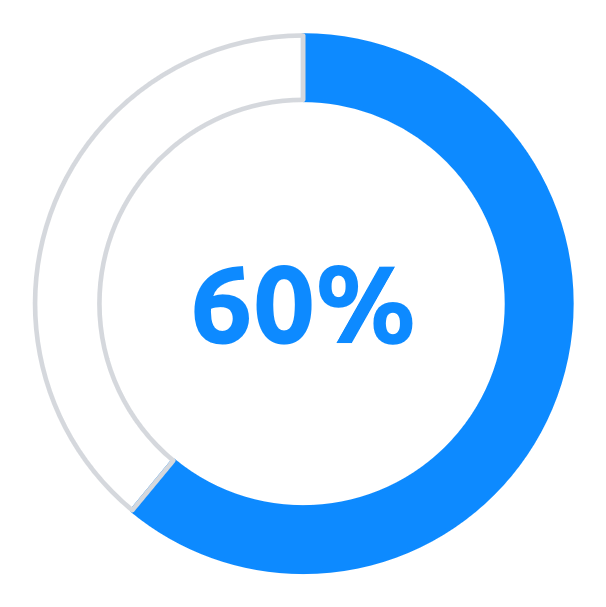
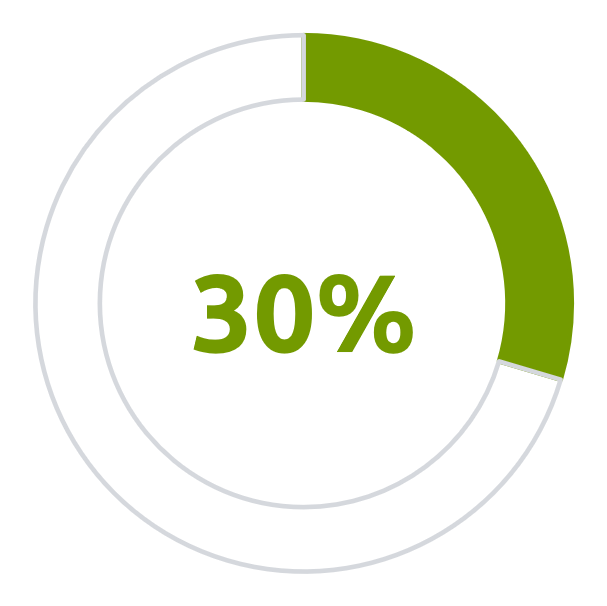
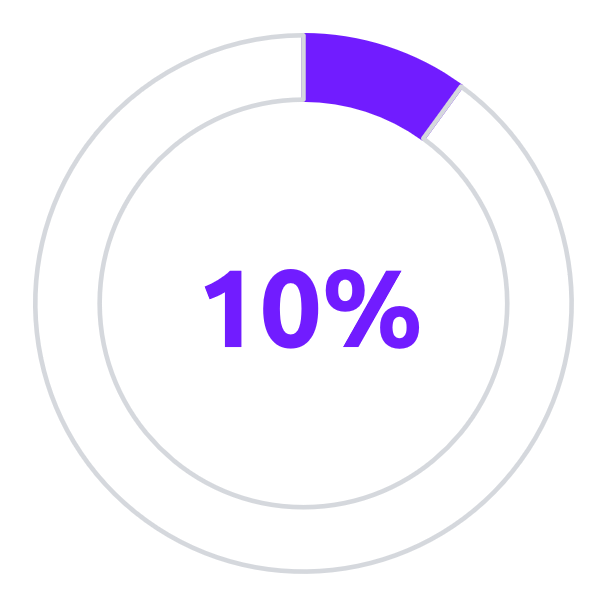
By Business Line
| Benefits & Engagement | Mobility | Complementary Solutions | |
| % of 2025 Group operating revenue |
 |
 |
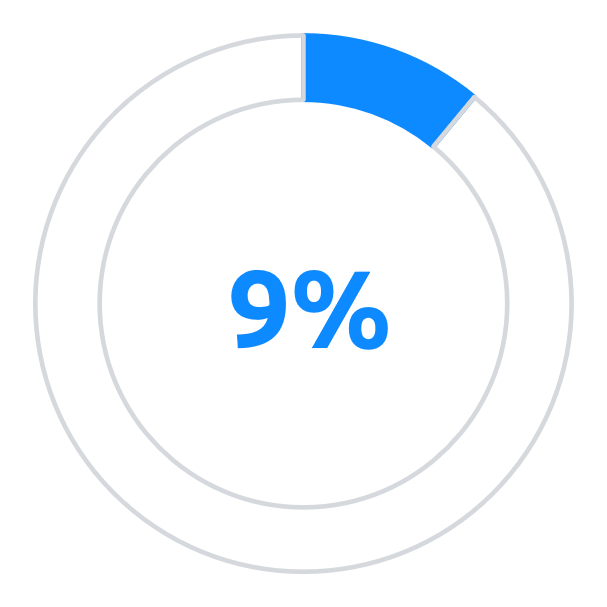 |
| Operating revenue 2025 | €1,763m | €710m | €259m |
| 2025 like-for-like operating revenue growth vs 2024 | +5.9% | +11.7% | -4.6% |
By geographical zone
| Europe | Latin America |
Rest of the World |
|
| % of 2025 Group operating revenue |
 |
 |
 |
| 2025 operating revenue | €1,636m | €826m | €270m |
| Growth like-for-like |
+1.0% | +13.2% | +16.8% |
| Growth reported | +3.4% | +7.5% | +4.9% |
Amplify 2025-2028
Objectives of the Amplify25-28 strategic plan for 2026 :
| L/L Annual EBITDA intrinsic growth | between +8% and +12% |
| Annual FCF/EBITDA intrinsic conversion rate(1) | ≥ 65% |
(1) At constant regulation and methodology (e.g. excl. impact from regulatory change in Brazil and Italy)